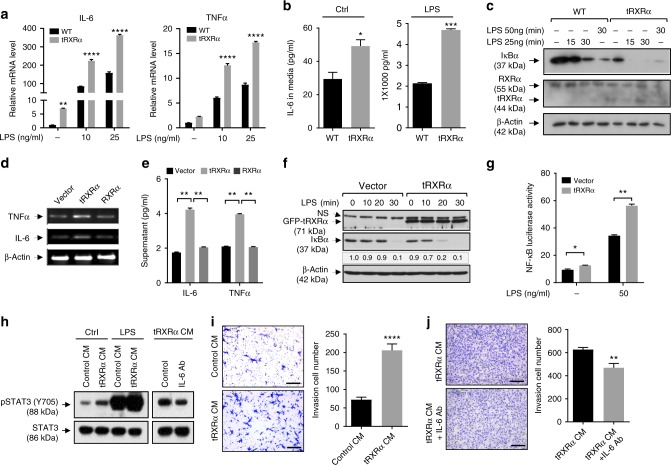
Fig. 5.
Truncated retinoid X receptor α (tRXRα) activation of the IKK-NF-κB pathway in macrophages. a Relative mRNA expression of interleukin (IL)-6 and tumor necrosis factor-α (TNFα) in wild-type (WT) and tRXRα-BMDMs treated with or without lipopolysaccharide (LPS) for 3 h was determined by quantitative reverse transcriptase–PCR (qRT-PCR), two-way analysis of variance (ANOVA). b WT and tRXRα-BMDMs cultured with Dulbecco’s modified Eagle’s medium containing 10% fetal bovine serum for 3 days or treated with LPS (25 ng/ml) for 12 h were analyzed by enzyme-linked immunosorbent assay (ELISA), t test. c Immunoblotting of lysates from WT and tRXRα-BMDMs treated with or without LPS for the indicated time. d Expression of IL-6 and TNFα mRNAs in RAW264.7 cells stably expressing green fluorescent protein (GFP), GFP-tRXRα, and GFP-RXRα was analyzed by RT-PCR. e Production of IL-6 and TNFα in RAW264.7 cells stably expressing GFP, GFP-tRXRα, and GFP-RXRα was analyzed ELISA, one-way ANOVA. f Stable expression of tRXRα in RAW264.7 cells potentiate LPS-induced IκBα degradation determined by immunoblotting. NS nonspecific. g Stable expression of tRXRα in RAW264.7 cells promotes LPS-induced NF-κB transactivation determined by reporter assay, two-way ANOVA. h Condition medium (CM) collected from WT- and tRXRα-BMDMs cultured for 3 days and treated with or without LPS (25 ng/ml) for 12 h was used to culture mouse CT26 colon cancer cells for 1 h and analyzed for signal transducer and activator of transcription factor 3 activation. Anti-IL-6 antibody (Ab) was incubated with CM of tRXRα-BMDMs for 1 h before being used to culture CT26 cells. i CT26 cells were cultured with CM collected from WT- or tRXRα-BMDMs for 24 h in transwell and analyzed by invasion assay. Representative images were photographed and migrated cells per field were counted. Scale bar, 200 μm, t test. j CM from tRXRα-BMDMs was incubated with or without IL-6 antibody and used to culture CT26 cells for 36 h. Representative images were photographed and migrated cells per field were counted. Scale bar, 200 μm, **P < 0.01 by t test. Data are mean ± SEM, *P < 0.05, **P < 0.01, ***P < 0.001, ****P < 0.0001. For immunoblotting, one of three or four similar experiments is shown

