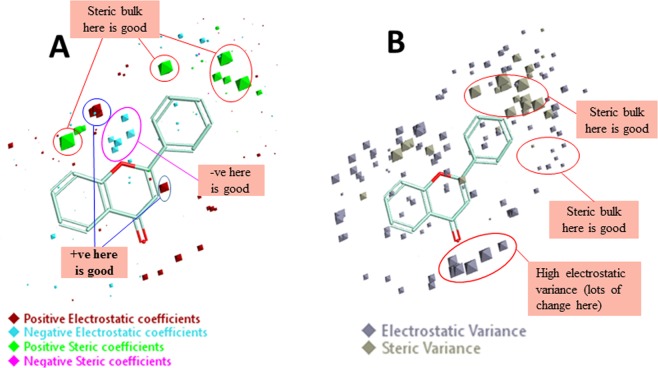
Figure 4.
Molecular insight of flavone (reference molecule) representing the coefficients and variance field points modulating the bioactivity through the derived 3D-QSAR model. (A) Model coefficient field points in red color (positive electrostatics), cyan color (negative electrostatics) and green color (positive steric coefficient) show the region of a substantial effect on higher activity. (B) High electrostatic variance and high steric variance field points represent the region of high changes and points with low variance indicates the fields in that region with less or no changes.

