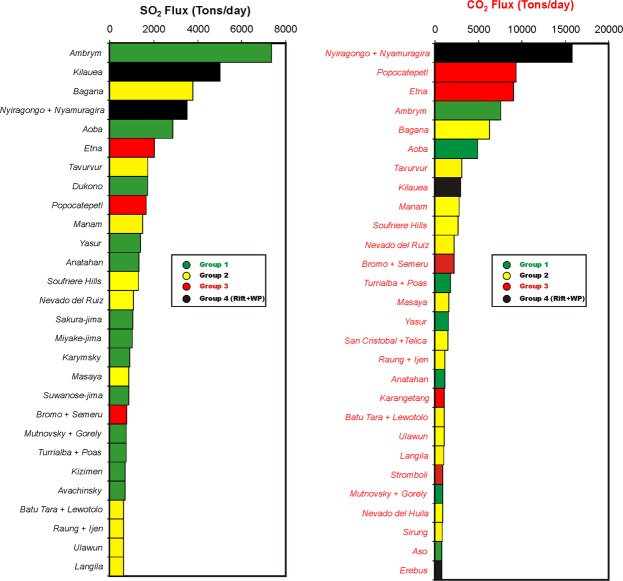
Figure 6.
The 28 top-ranking volcanic point sources of SO2 (left) and CO2 (right) during 2005–2015. Data are from Table 1. SO2 fluxes are 2005–2015 means from ref.30. The CO2 fluxes are calculated from SO2 using measured or predicted CO2/SO2 ratios (see Table 1). Different volcano groups are identified by different colours. The global CO2 budget is dominated by CO2-rich Group 2–3 arc volcanoes. Two rift volcanoes (Nyiragongo and Nyamuragira) and one within-plate (WP) volcano (Kilauea) appears in the top-10 list of CO2 emitting volcanoes110.

