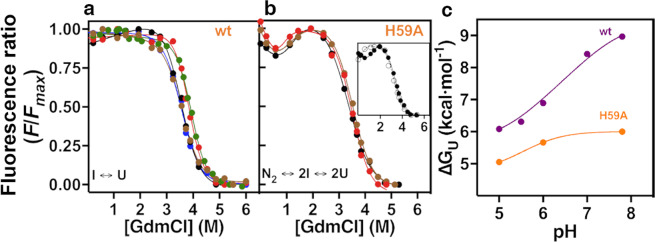
Figure 3.
Equilibrium unfolding experiments of wt FoxP1 and H59A mutant. Protein unfolding as a function of denaturant (GdmCl) was monitored using intrinsic fluorescence for wt (a) and H59A (b) at a total protein concentration of 15 μM. (a) wt FoxP1 was incubated with different denaturant concentrations at pH 5.0 (black), 5.5 (blue), 6.0 (brown), 7.0 (green) and 7.8 (red), and the data obtained were fitted to a two-state I U monomer unfolding. (b) The same unfolding experiment was performed with the H59A mutant at pH 5.0, 6.0 and 7.8, using the same colour pattern as for wt protein. Data was fitted to a three-state N2 2I 2U unfolding mechanism. Inset. Unfolding curves of the H59A mutant at pH 5.0 using 3 (white circles) or 15 μM (black circles) of total protein concentration. (c) ∆Gu dependence with pH for wt and the H59A mutant. Free energy values for intermediate unfolding (I U) obtained were fitted to Wyman-Tanford relationship (Eq. 2) to calculate the pKa changes between the intermediate and unfolded states.

