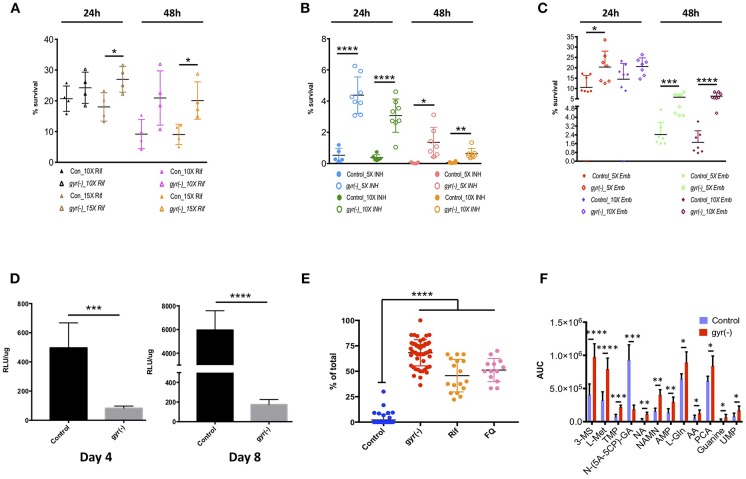
Figure 4.
Depletion of DNA gyrase induces persister formation. Antibiotic susceptibility of gyrase knockdown strain to the first-line anti-TB drugs was determined by exposing bacterial cultures of control and gyr(-) at OD600 of 0.05 to different concentrations of drugs followed by CFU enumeration. Cell survival is expressed as percentage survival relative to drug-untreated cells. Reference minimum inhibitory concentration (MIC) of each drug against wild-type Mtb was obtained from the published literature. Shown are the dot-plots exhibiting the time- and dose-dependent survival kinetics of both the strains after treatment with: (A) Rif, (B) INH, and (C) Emb. Error bars represent the SD from at least four different measurements. Statistical significance is determined by paired Student's t-test: *P < 0.05, **P < 0.01, ***P < 0.001, and ****P < 0.0001. (D) Estimation of intracellular ATP levels. Intracellular ATP levels were measured in control and gyr(-) after 4- and 8 days of treatment with 20 ng/ml ATc by using BacTiter-Glo™ microbial cell viability assay (Promega). Final ATP levels were calculated after normalizing the intensity of luminescence (expressed as relative luminescence unit [RLU]) with total protein concentration in each sample. Error bars represent the SD from at least three different experiments. Statistical significance is determined by paired Student's t-test: ***P < 0.001 and ****P < 0.0001. (E) Estimation of lipid bodies. Lipid bodies (LB) were estimated in bacteria stained with Nile red by counting lipid-rich foci under confocal laser scanning microscopy using 100x oil objective. The dot plot shows percentage of total cells exhibiting >2 LBs in control, gyr(-), Rif- and FQ-treated wild-type Mtb, respectively. Data were obtained by estimating LBs in at least 200 bacterial cells from multiple fields. Error bars represent the SD from three different measurements. Statistical significance is determined by paired Student's t-test: ****P < 0.0001. (F) Comparative analysis of metabolites in control and gyr(-) strains of Mtb. Quantitative estimation of metabolites in control and gyr(-) was performed by LC-MS/MS and average values from six different experiments are plotted in the bar graph. Shown are the metabolites that are modulated by >1.3-fold in gyr(-) compared to control Mtb. Statistical significance is determined by paired Student's t-test: *P < 0.05, **P < 0.01, ***P < 0.001, and ****P < 0.0001.

