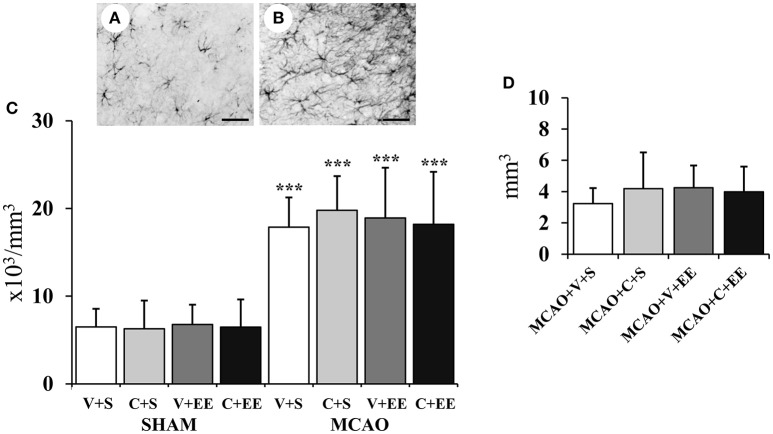
Figure 7.
Quantification of perilesional gliosis. Representative staining of GFAP-stained sections from a sham-operated rat (A) and an MCAO rat (B). Stereological analysis revealed an ischemia-induced increase in the number of glial cells in the perilesional cortex (C). Glial scar volume did not differ between the MCAO groups (D). Scale 50 μm. Statistical significance: ***P < 0.001 (compared to SHAM+V+S). SHAM, sham-operated; MCAO, middle cerebral artery occlusion; V, 2 d vehicle; C, 2 d cell infusion; S, standard housing; EE, enriched environment.

