
Figure 5.
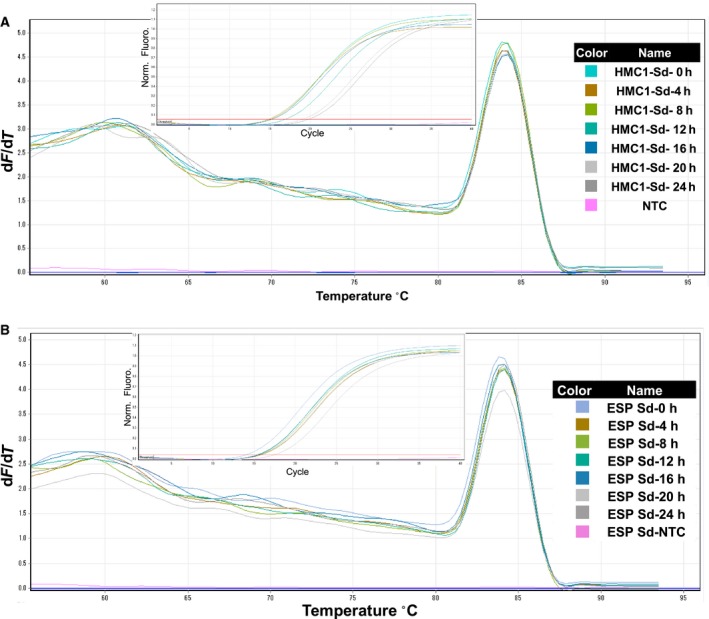
Quality analyses of cDNA from total RNA that was extracted using the present modified protocol; leaf samples were taken from the cassava genotypes HMC‐1 and ESP at indicated time points, and qRT‐PCR analyses were performed using primers for 18S. (A) Amplification plot and melting curves for HMC‐1 genotype; (B) amplification plot and melting curve for ESP genotype. For details of all curves, see Fig. 3 legend.