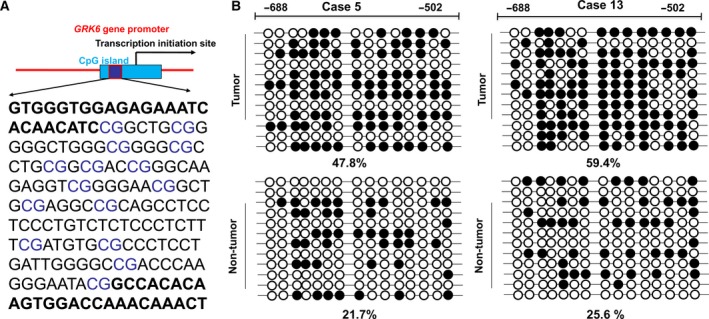
Figure 3.

Analysis of the methylation status of the GRK6 gene promoter in LADC tissues and adjacent non‐tumor tissues determined by a BSP assay. (A) A schematic map of CpG islands showing the locations of the 15 CpG sites in the GRK6 gene promoter region. (B) Representative BSP results of methylation in LADC tissues and matched adjacent non‐tumor tissues of case 5 and case 13. Each row represents an individual cloned allele. Each circle represents a CpG site. The black circles show methylated CpG sites, and the white circles show unmethylated CpG sites. The data represent the results from three independent experiments.
