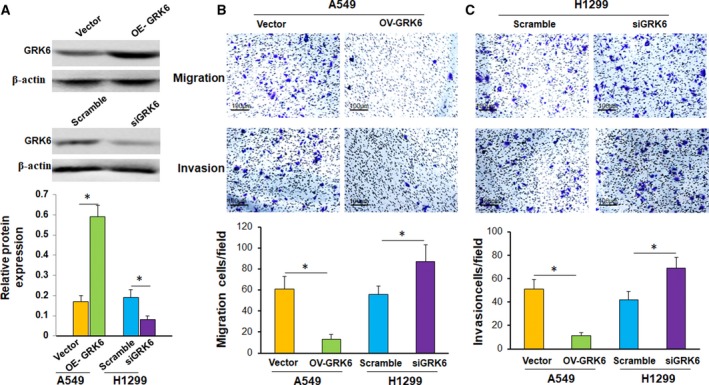
Figure 7.

The effects of GRK6 on cell migration and invasion. (A) After transfection with siRNA or pcDNA3.1‐GRK6, the expression of the GRK6 protein decreased or increased significantly, respectively (*P < 0.05, Student's t test). Data are presented as means ± SD. (B) Upregulation of GRK6 significantly inhibited cell migration and invasion (*P < 0.05, Student's t test). Data are presented as means ± SD. (C) Downregulation of GRK6 significantly promoted cell migration and invasion (*P < 0.05, Student's t test). Original magnification: ×200. Data are presented as means ± SD. The data represent the results from three independent experiments.
