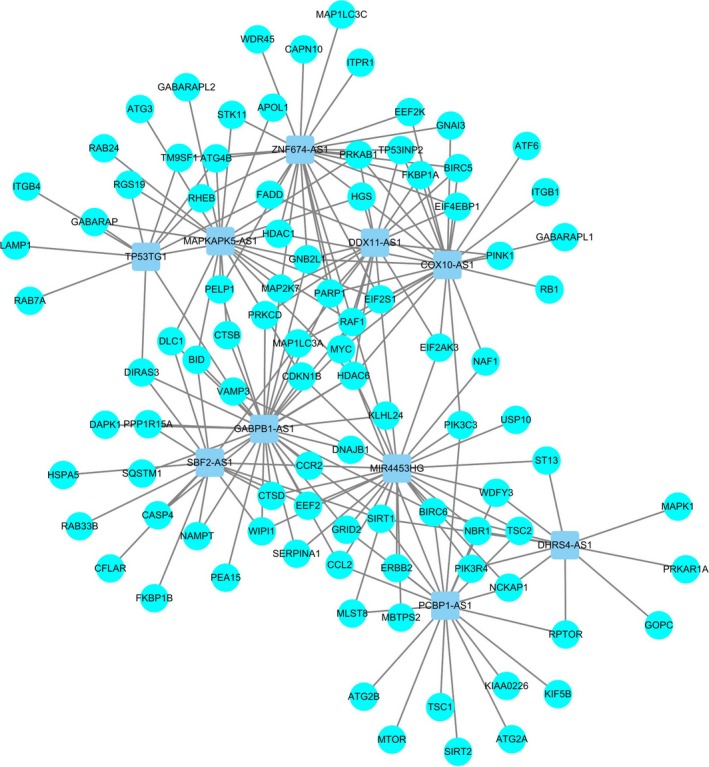
Figure 1.

Network of prognostic lncRNAs with co‐expressed autophagy genes in glioma. In the centric position, grey blue nodes indicate lncRNAs and the sky blue indicates autophagy genes. The coexpression network is visualized by cytoscape 3.4 software.
