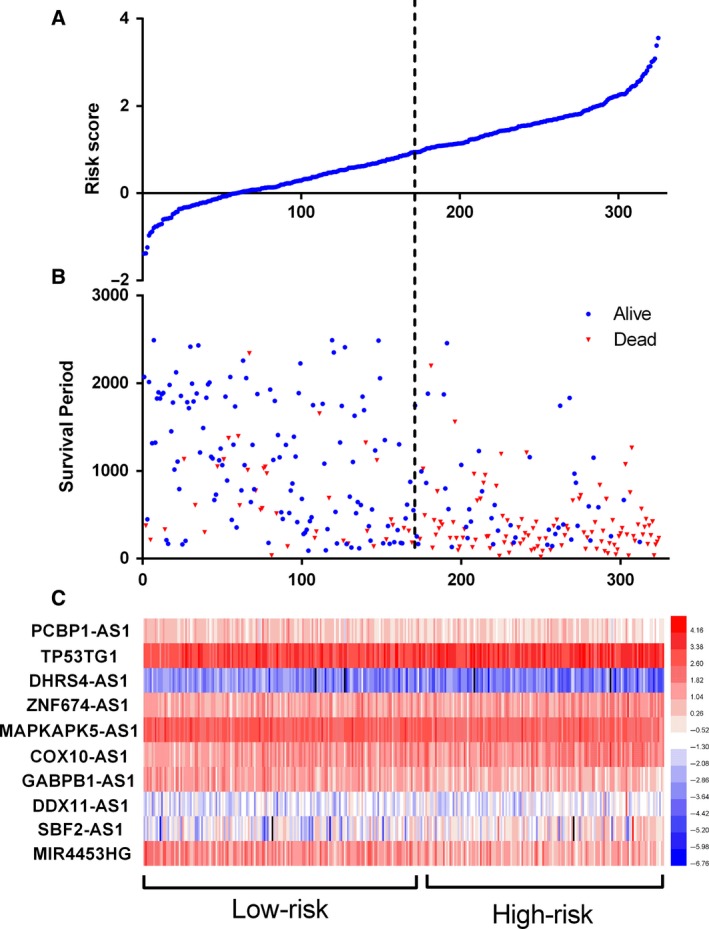
Figure 3.

Autophagy‐related lncRNA risk score analysis of glioma patients in CCGA. (A) The low and high score group for the autophagy‐related lncRNA signature in glioma patients. (B) The survival status and duration of glioma cases. (C) Heatmap of the 10 key lncRNAs expression in glioma. The color from blue to red shows an increasing trend from low levels to high levels.
