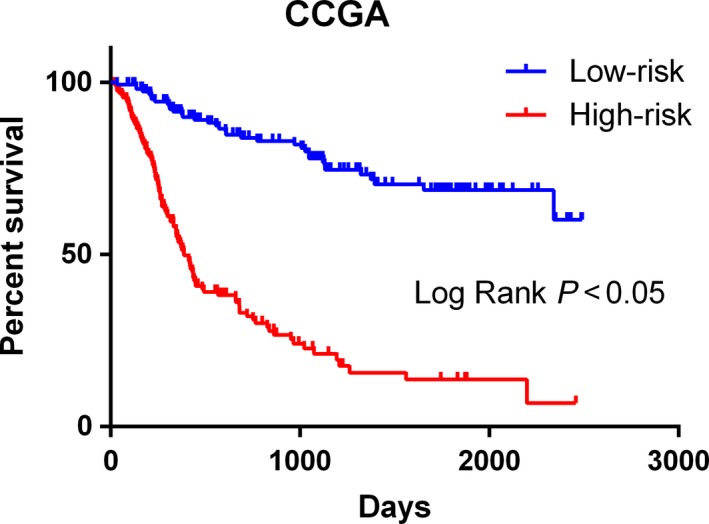
Figure 4.

Kaplan–Meier survival curves for the autophagy‐related lncRNA risk score for glioma in CCGA dataset. The Kaplan–Meier survival curves showed that the OS period is longer in the low‐risk group than that in the high‐risk group in the CCGA datasets (median OS 1211 vs 346 days; log rank P < 0.05).
