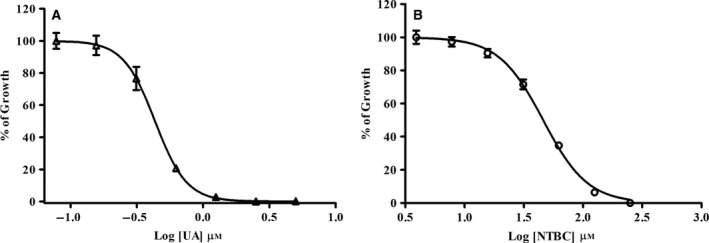
Figure 3.

Dose–response curves of parasite viability in the presence of usnic acid (UA) or nitisinone (NTBC) at 72 h of treatment by MTT methodology. (A) Usnic acid inhibited parasite growth in a dose‐dependent manner (IC 50: 0.433 ± 0.071 μm), and (B) NTBC inhibited parasite growth in a dose‐dependent manner too (IC 50: 47.87 ± 10 μm). Data are representative of three independent experiments; each experiment done contained three technical triplicates. These data are expressed as means ± SD.
