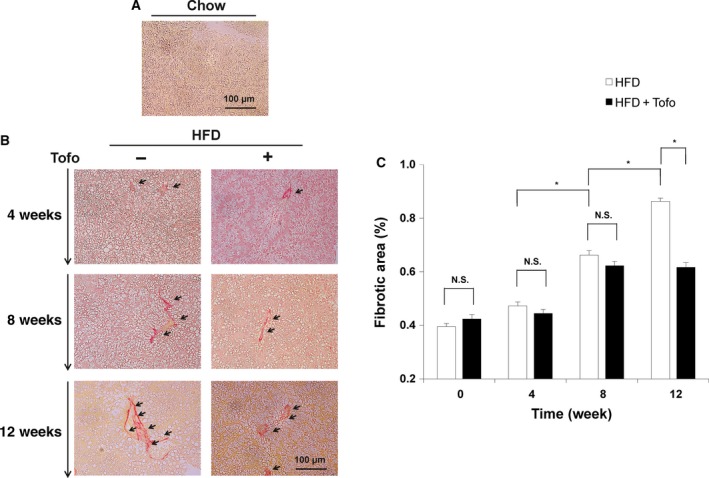
Figure 4.

Effects of Tofo on the deposition of fibrotic tissue in the liver of medaka NASH model. Representative microscopic findings of medaka liver tissues stained with Sirius Red. (A) Chow‐diet‐fed medaka. (B) Medaka fed with HFD and HFD + Tofo for 4, 8, and 12 weeks. Black arrows indicate fibrotic tissues. Scale bar represents 100 μm. (C) Quantitative analysis of the fibrotic area in the medaka liver. The values represent mean ± SD (n = 15 for each group). *P < 0.05, and N.S., no statistical significance. Student's t‐test.
