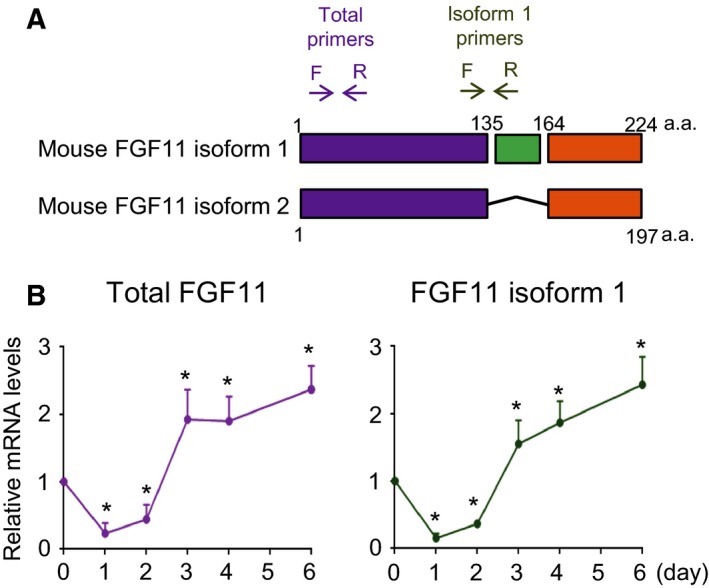
Figure 1.

The mRNA level of FGF11 during adipogenesis. (A) Schematic diagram of mouse FGF11 isoforms. The arrows represent the positions of specific primers. Total primers, the position of the specific primers for total FGF11; isoform 1 primers, the position of the specific primers for FGF11 isoform 1. (B) Growth‐arrested 3T3‐L1 preadipocytes were incubated with differentiation inducers, and total mRNA was harvested daily. The FGF11 mRNA level was determined by real‐time RT/PCR and normalized to the 18s rRNA level. The value from harvested cells just before the adipogenic induction (day 0) was set to 1, and the others were calculated relative to this value (mean ± SEM, n = 4). The significance was assessed using the Mann–Whitney U‐test. *P < 0.05 vs day 0.
