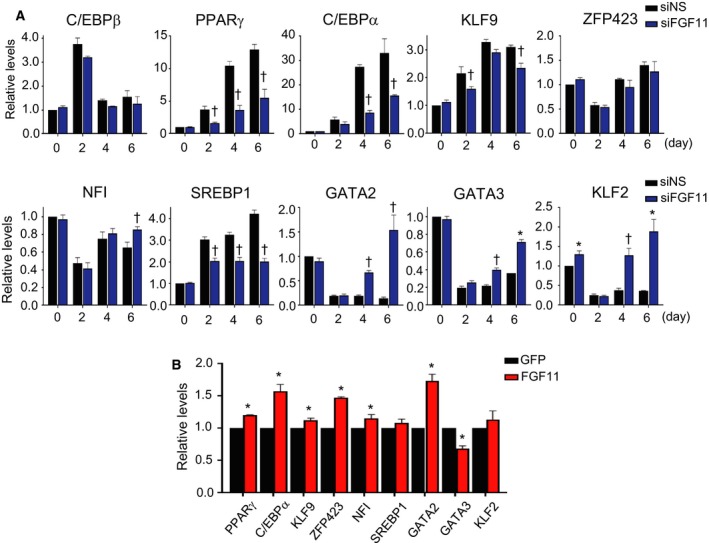
Figure 5.

The expression level of genes involved in adipogenesis by FGF11 knockdown or FGF11 overexpression. (A) One day before adipogenic induction, growth‐arrested 3T3‐L1 preadipocytes were transfected with 50 nm of siFGF11 or siNS. Total RNAs at the indicated days were isolated and subjected to real‐time RT/PCR using specific primers as described in Table 1. The values of siNS‐treated cells at day 0 were set to 1, and the other values were calculated relative to this value (n = 3, average ± SEM). The significance was assessed using the Mann–Whitney U‐test. *P < 0.05 vs siNS at the same time point. †P = 0.05 vs siNS at the same time point. (B) FGF11 was overexpressed using an adenoviral expression system (600 MOI) on day 2 of adipogenesis. Adipocyte differentiation progressed until day 4 of adipogenesis, and total RNAs were prepared for real‐time RT/PCR using specific primers. The value of GFP of each was set to 1, and the value of FGF11 of each sample was calculated relative to this value (n = 3, average ± SEM). The significance was assessed using the Mann–Whitney U‐test. *P < 0.05 vs GFP each.
