
Figure 4.
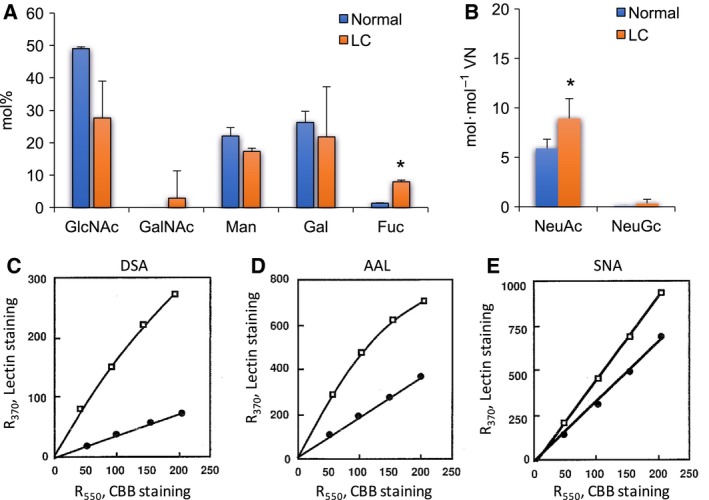
Carbohydrate analyses of LC‐VNs. (A,B) Carbohydrate analyses by HPLC. (A) Neutral sugars and hexosamines are expressed as mol% of total carbohydrates. Normal (blue bar) and LC (orange bar) VNs (4.5 μg) were hydrolyzed, N‐acetylated and labelled with 2‐aminopyridine (PA). PA‐carbohydrates were analyzed by reverse‐phase HPLC on a PALPAK Type A column as described in Materials and methods. (B) The sialic acid concentration is expressed as mol·mol−1 VN. After hydrolysis of normal (blue bar) and LC (orange bar) VNs (1.5 μg), released sialic acids were labelled with DMB and analyzed on a CLC‐ODS column as described in Materials and methods. (C–E) Dose dependency of lectin reactions. Various amounts of normal (closed circles) or LC (open squares) VN were dot‐blotted onto a PVDF membrane and stained with CBB or reacted with biotinyl lectins, DSA (C), AAL (D), and SNA (E). The staining intensities were measured by a refractive densitometer at 370 nm for lectin staining or 550 nm for CBB staining. Data are presented as mean ± SD. *P < 0.05 compared to normal by t‐test. n = 3–4.