Figure 5.

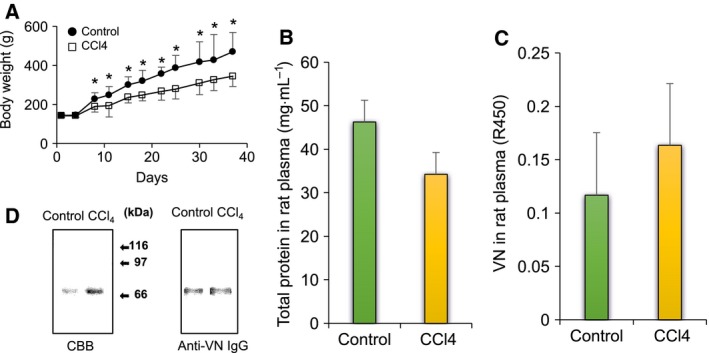
Amounts of protein and VN in CCl4‐treated rat plasma. CCl4 and olive oil were administered to rats twice a week. After 6 weeks, rats were sacrificed and blood collected. (A) Average weight of rats. Body weights of rats administered olive oil as a control (closed circle) and CCl4 (open square) were measured at the time of administration. n = 6–13. (B) Total protein. Diluted plasma (100–200 times) was measured by using tunein‐TP. Control: green bar; CCl4: yellow bar. n = 4. (C) VN level in plasma. Diluted plasma (2000–8000 times) was dot‐blotted onto a PVDF membrane and immunostained for VN. The staining intensity was measured by a refractive densitometer at 450 nm and corrected using the immunoreactivity of each VN. Control: green bar; CCl4: yellow bar. n = 4. (D) SDS/PAGE and immunostaining of VNs. Purified VNs (3 μg) from control and CCl4‐treated plasma were loaded on each lane of a 9.5% acrylamide gel, and SDS/PAGE was performed in the presence of 2‐mercaptoethanol. Loading gels were transferred to PVDF membranes and stained with CBB (left) or sheep anti‐VN IgG and HRP‐anti‐sheep IgGs (right) as described in Materials and methods. Data are presented as mean ± SD. *P < 0.05 compared to control by Mann–Whitney U test.
