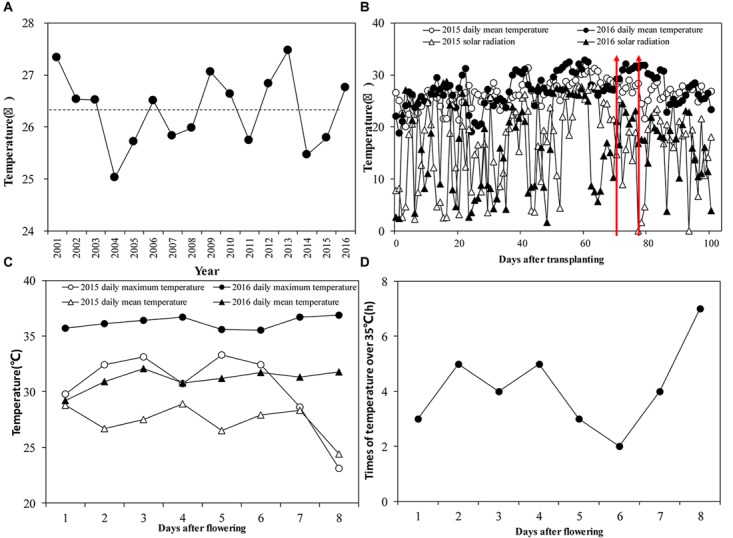
FIGURE 2.

(A) Seasonal mean temperature from June to September of 2001–2016. The dotted line is the average seasonal mean temperature; (B) Daily mean temperature and solar radiation from transplanting to maturity in 2015 and 2016. The red arrows indicate the flowering stage at Jingzhou in 2015 and 2016; (C) Average daily mean temperature during the flowering stage in 2015 and 2016; (D) Duration of temperatures >35°C during the flowering stage in 2016.
