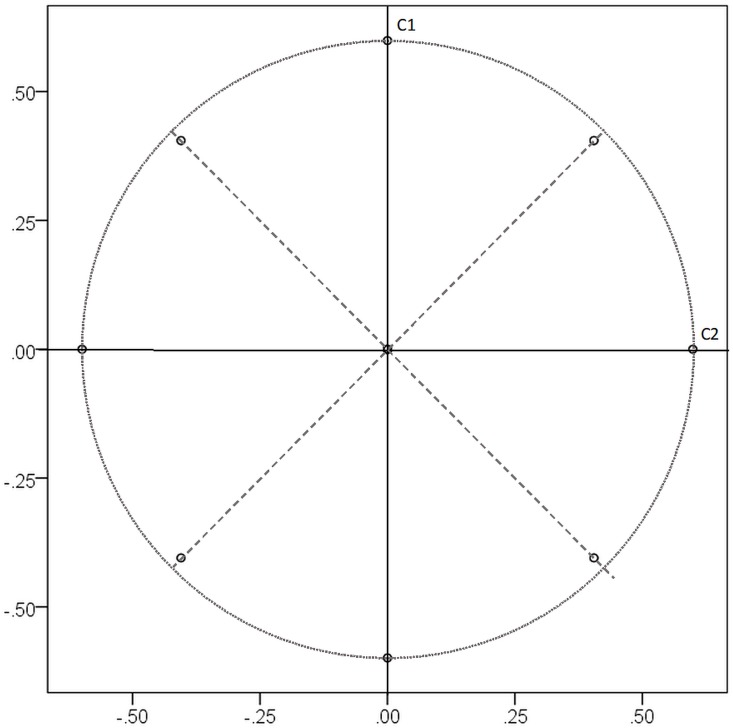
FIGURE 1.
Loadings of 24 variables on component 1 (C1) and 2 (C2) of the global optimum solution (no Kaiser normalization) given in Table 2. The dotted circle marks the size of the largest main loadings on C1 and C2, the dashed lines mark the two components of the local optimum solution.

