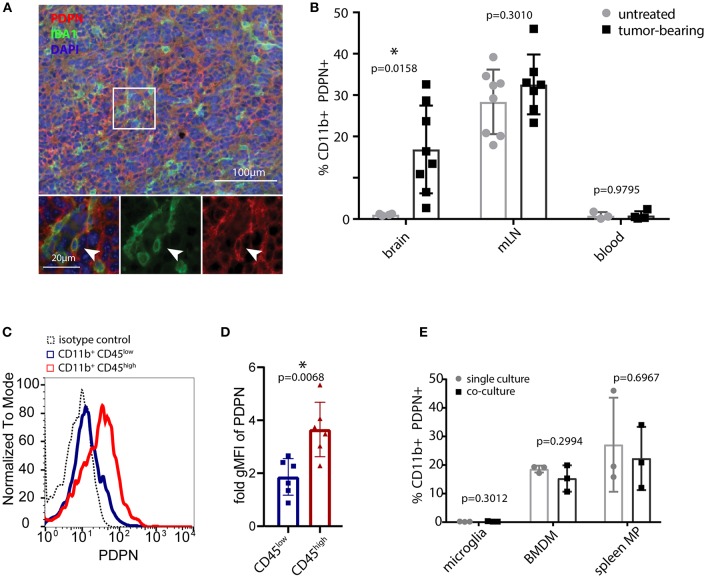
Figure 1.
PDPN+ myeloid cells are present in lymphoid tissue and glioma tumors. (A) Immunofluorescence staining of high-grade murine glioma for PDPN (red) and IBA1 (green) shows co-expression in a subset of cells. Nuclei were stained with DAPI and pseudocolored in blue. Arrowhead indicates a cell co-expressing PDPN and IBA1. (B) Flow cytometry of brain, mandibular lymph nodes (mLN) and blood of untreated and tumor-bearing mice. Data represent mean and SD. Statistical analysis: Student's t-test. n = 4 and n = 8 for brain of untreated and tumor-bearing mice respectively. n = 8 and n = 7 mLN of untreated and tumor-bearing mice respectively. n = 3 and n = 4 for blood of untreated and tumor-bearing mice respectively. (C) Flow cytometry of glioma-associated myeloid cells shows PDPN is predominantly expressed by CD11b+ CD45high cells. (D) Quantification of geometric mean fluorescence intensity representative for PDPN levels on CD11b+CD45low and CD11b+CD45high cells, normalized to isotype control staining. Statistical analysis (Student's t-test of logarithmized values) revealed significantly higher expression of PDPN in CD11b+CD45high cells, p = 0.007; n = 6. (E) Flow cytometry of PDPN expression of microglia, bone marrow-derived macrophages (BMDM) and spleen macrophages in single- or co-culture with glioma cell line LN308. Bar graphs indicate percentage of PDPN+ cells of all CD11b+ cells, data represent mean and SD. Statistical analysis: Student's t-test. n = 3 for all samples. *p < 0.05, **p < 0.001.

