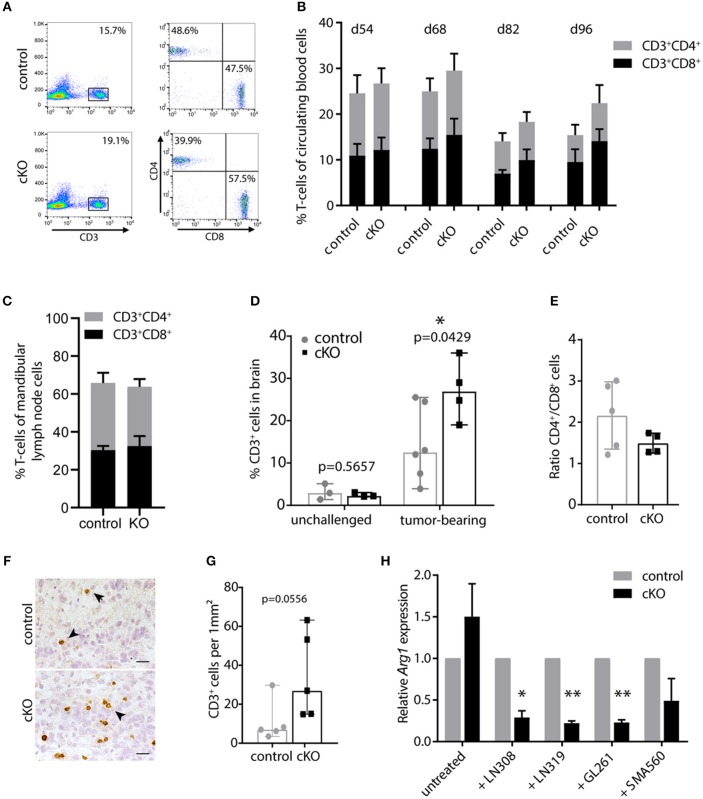
Figure 3.
PDPN+ myeloid cells execute an immune inhibitory function. (A) Flow cytometry plots of one control and one cKO animal 82 days after tumor cell transplantation. CD3+ T-cells were pre-gated for lack of 7AAD and analyzed for CD4 and CD8 expression. (B) Time course of flow cytometric analysis of circulating CD3+CD4+ and CD3+CD8+ T-cells of tumor-bearing control and cKO animals. Days post tumor cell injection are indicated on top. Statistical comparison (Student's t-test) of T-cell percentages between control and cKO animals showed following p-values: 0.05; 0.25; 0.047 and 0.056 at d54; d68; d82 and d96, respectively, n = 8. (C) Percentage of CD3+CD4+ and CD3+CD8+ T-cells in mandibular lymph nodes is not altered between glioma-bearing control and cKO mice. Statistical comparison (Student's t-test) of T-cell percentages between control and cKO animals showed following p-value 0.6647; n = 5 (control) and n = 4 (cKO). Data (B,C) represent mean and SD. (D) Percentages of brain-infiltrating CD3+ T-cells are increased by tumor growth and are significantly elevated in tumors of cKO mice. Statistical analysis: Student's t-test, n = 3 (each unchallenged control and cKO); n = 6 (tumor-bearing control); n = 4 (tumor-bearing cKO). (E) CD4+/CD8+ ratio of CD3+ cells detected in the brain by flow cytometry. Statistical analysis: Student's t-test. p = 0.1609; n = 5 (control) and n = 4 (cKO). (F) Representative immunohistochemical staining of CD3, scale bar 25 μm (G) Corresponding quantification of CD3+ cells in tumors of control and cKO animals shows a clear tendency to increased T-cell infiltration in cKO mice (p = 0.0556, Mann-Whitney test, n = 5). Data (D,E,G) represent median and 95% CI. (H) Relative Arg1 expression in BMDM isolated from control or cKO animals analyzed by quantitative Real-Time PCR, performed with biological triplicates. Values normalized to house-keeping gene Ppia. Arg1 expression of cKO macrophages was normalized to expression of control macrophages for each condition. Arg1 expression is significantly attenuated in Pdpn knockout macrophages when co-cultivated with LN308 (p = 0.0173), LN319 (p = 0.002), or GL261 (p = 0.0029), p-value for SMA-560-co-cultivation = 0.111, paired Student's t-test of logarithmized values, n = 3. *p < 0.05, **p < 0.001.

