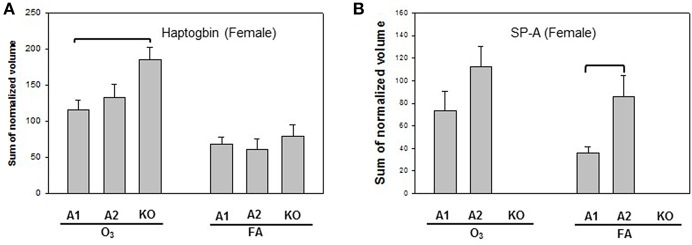
Figure 3.
Representative graphs of significant protein changes among genotypes in female mice. Two proteins (haptoglobin and SP-A) exhibit significant differences in comparisons among SP-A genotypes of female mice after exposure to ozone (O3) or filtered air (FA). Histograms depicting levels of each specific protein are shown in (A) (Haptoglobin) and (B) (SP-A). Comparisons between groups that were statistically significant (p < 0.05) are indicated with a bracket.

