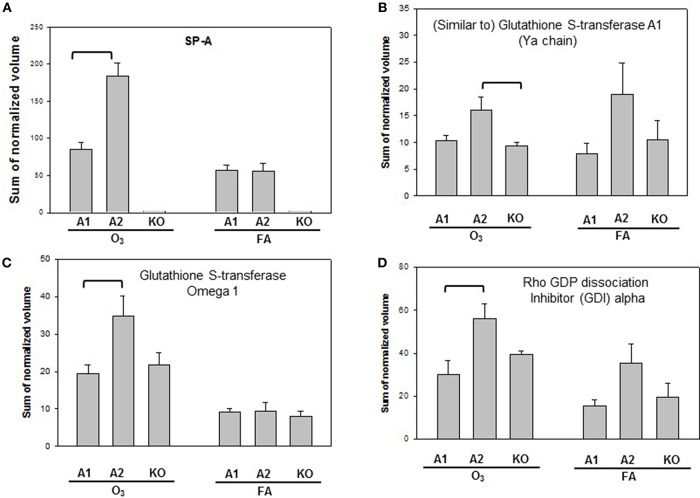
Figure 5.
Representative graphs of specific protein changes among genotypes of ozone-exposed male mice. Histograms depict levels of each specific protein, (A) SP-A; (B) (Similar to) glutathione S-transferase A1; (C) glutathione S transferase, omega 1; (D) Rho GDP dissociation inhibitor (GDI) alpha. These proteins exhibit significant differences in one group of comparisons of male mice with different genotypes (A1, A2, KO) after exposure to O3 and bacterial infection. Comparisons between groups that are statistically significant (p < 0.05) are indicated with a bracket.

