
Figure 2.
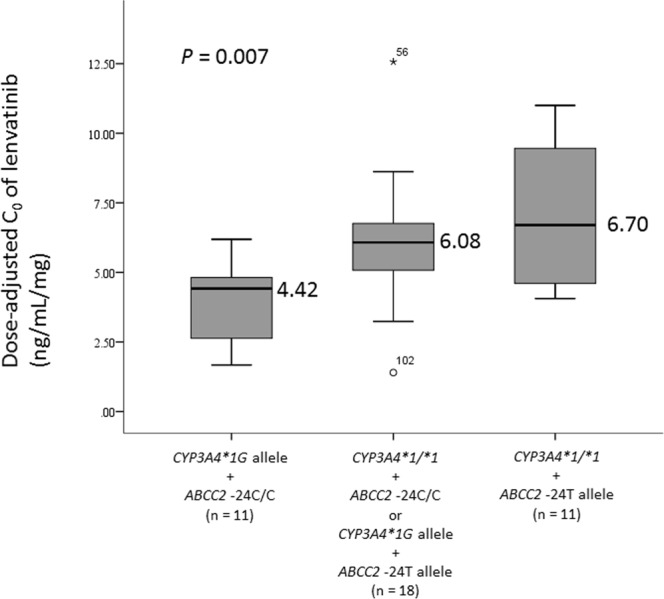
Effects of CYP3A4*1G and ABCC2 −24C > T polymorphisms on the steady-state mean plasma trough concentrations of lenvatinib. Graphical analysis was performed using a box and whiskers plot. The box spanned data between 2 quartiles (IQR), with the median represented as a bold horizontal line. The ends of the whiskers (vertical lines) represent the smallest and largest values that are not outliers. Outliers (circle) are values between 1.5 and 3 IQRs from the end of the box. Values more than three IQRs from the end of the box are defined as extremes (stars).