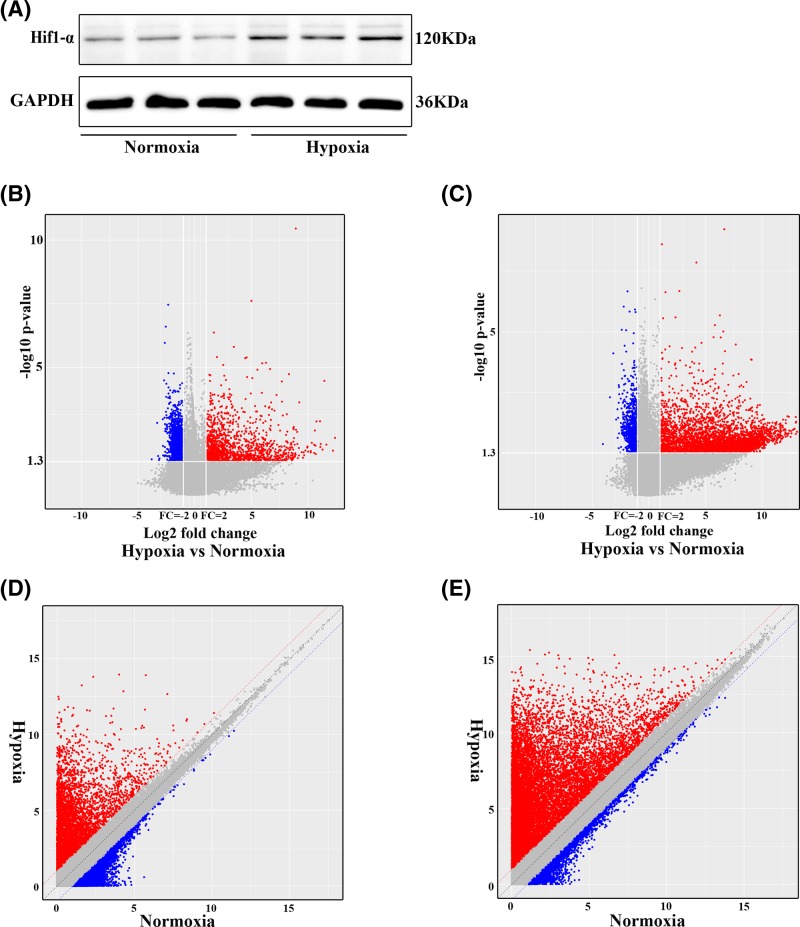
Figure 1. LncRNA and mRNA expression profiles in hypoxic and normoxic MOVAS cells.
(A). Detection of HIF1-α expression using Western blotting assay. Scatter plots were used to distinguish the differentially expressed (B) lncRNA and (C) mRNA between hypoxic and normoxic groups, respectively. (D) and (E) Volcano plots of lncRNAs and mRNA expression levels between the hypoxic and normoxic groups, respectively. The dendrogram demonstrates the relationships of the lncRNA and mRNA expression profiles between the hypoxia and normoxia MOVAS cell samples, The red dots represent up-regulated lncRNAs and mRNAs, and the green dots represent the down-regulated lncRNAs and mRNAs, respectively (P<0.05; fold change > 2.0).

