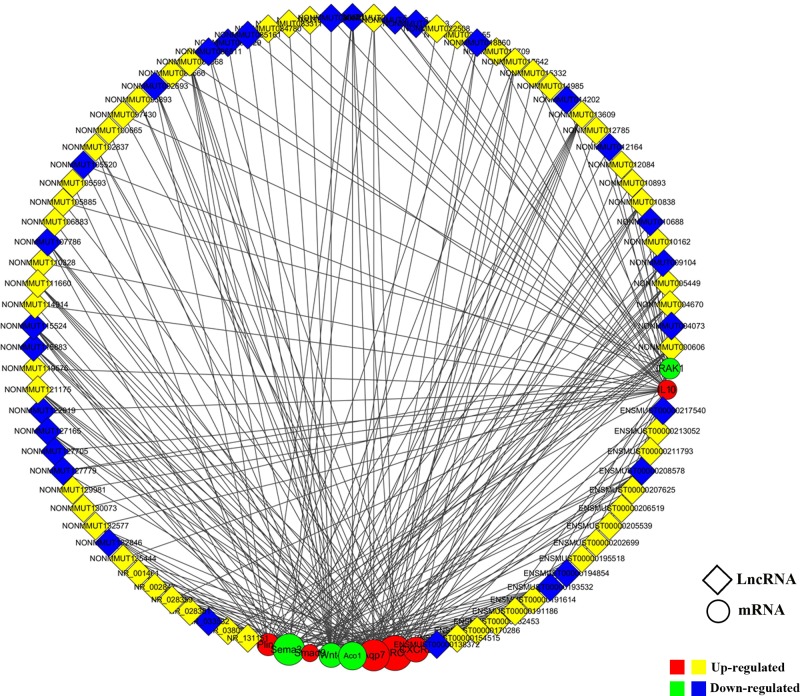
Figure 4. Construction of the lncRNA–mRNA coexpression network.
Coexpression network analyses were performed to characterize the 87 differentially expressed lncRNAs and ten differentially expressed mRNAs (six up-regulated and four down-regulated) based on the microarray results using Cytoscape 3.5.1 software. Red circular nodes indicate up-regulated mRNAs, and green circular nodes indicated down-regualted mRNAs. Yellow rhombus nodes denote up-regulated lncRNAs, whereas blue rhombus nodes designate down-regulated lncRNAs.

