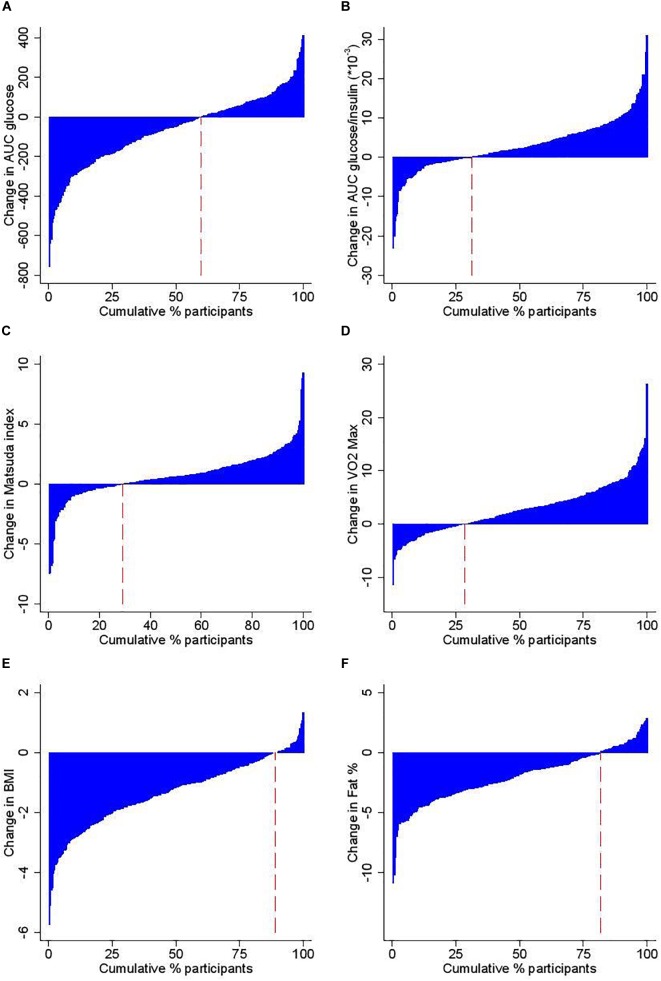
FIGURE 1.
Study participants according to change following the 12 week intervention in (A) Area Under the Curve (AUC) for Glucose during the OGTT, (B) AUC for Glucose/Insulin during the OGTT, (C) insulin sensitivity as estimated by the Matsuda index, (D) VO2max, (E) BMI, and (F) % body fat. The red dashed line indicates the proportion of individuals with a lowered outcome level after the intervention.

