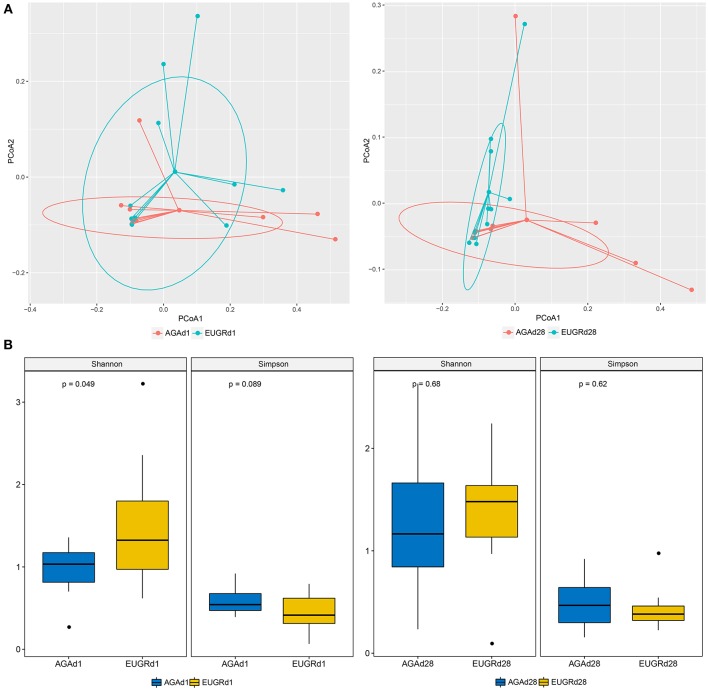
Figure 2.
Principal coordinate analysis and alpha diversity plots in intestinal microbiota. (A) Weighted UniFrac PCoA plot based on OTU abundance. Each point represents the intestinal microbiota of a newborn in the EUGR group (red) and AGA group (green). (B) Comparison of the microbiome biodiversity between infants with EUGR and normal growth, the Shannon index, Simpson index were shown as estimators.

