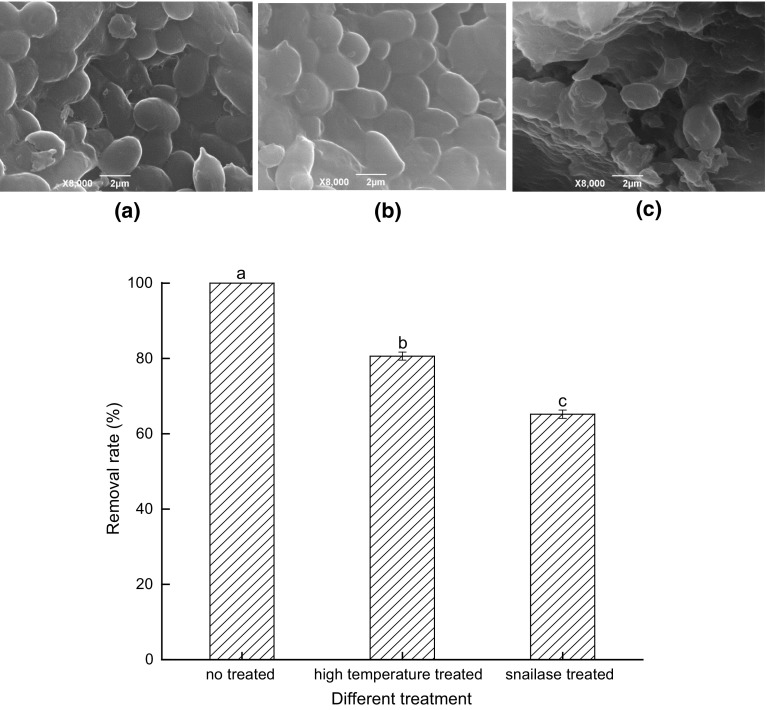
Fig. 2.
SEM images of S.cerevisiae CCTCC 93161 cells with different treatments at 8000 × magnification and their removal efficiencies of PAT, Intact Cells (a), Inactivated Cells (b) and Protoplasts (c). Bars with different letters are significantly different at p < 0.05 according to Duncan’s multiple range test

