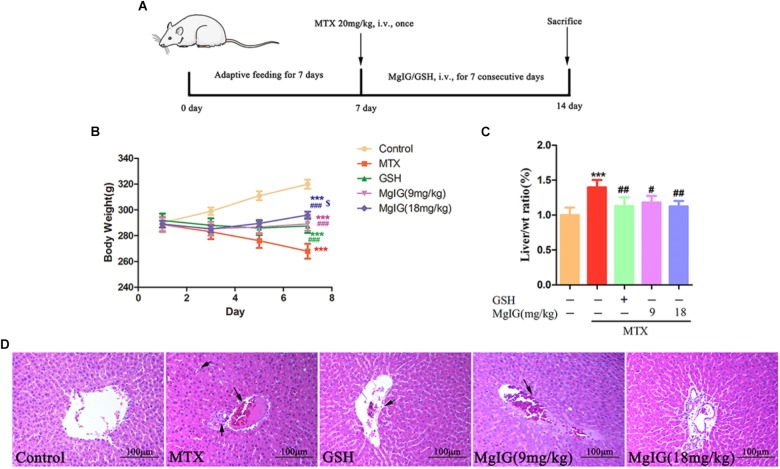
FIGURE 1.
Effect of MgIG and MTX on body weight and liver weight/body weight ratio. (A) Experimental protocols for MTX-induced hepatotoxicity in rats pretreated with MgIG and GSH; (B) body weight; (C) liver weight/body weight ratio [Liver/wt ratio (%)]; (D) effects of treatment with MgIG and GSH on histopathological lesions in liver tissues following MTX-induced hepatotoxicity. Microscopic views from the pericentral zone of rat liver stained with HE are shown; magnifications: ×400. Values of body weight and liver weight are shown as mean ±SD, n = 6. Significance: Compared with control: ∗P < 0.05, ∗∗P < 0.01, ∗∗∗P < 0.001; compared with MTX group: #P < 0.05, ##P < 0.01, ###P < 0.001; compared with GSH group: $P < 0.05. The arrow means congestion of RBCs, infiltration of inflammatory cells and pyknosis in liver.

