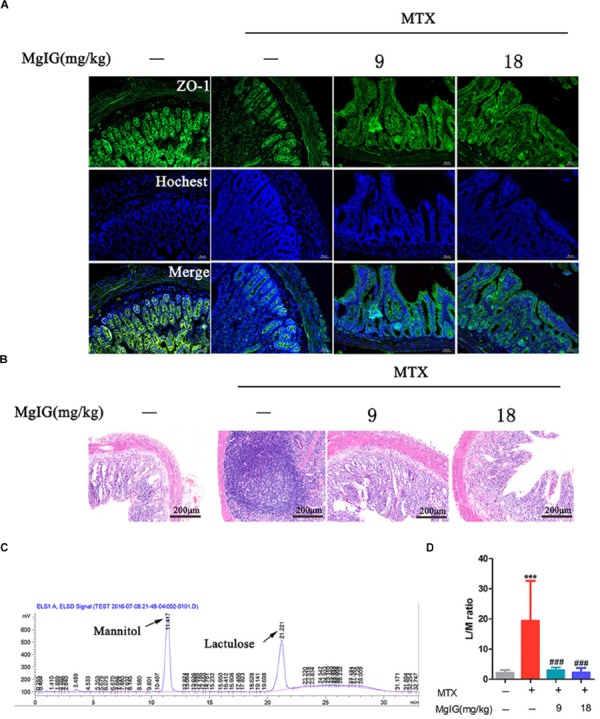
FIGURE 5.

Effect of MgIG on MTX induced intestinal damage (A) Immunofluorescence analysis of ZO-1 (green); (B) intestinal sections were stained with HE; (C) chromatograms of lactose and mannitol; (D) lactulose and mannitol excretion in the urine of rats. The results are shown as means ±SD of six rats per group. Compared with control group: ∗P < 0.05, ∗∗P < 0.01, ∗∗∗P < 0.001; compared with MTX group: #P < 0.05, ##P < 0.01, ###P < 0.001.
