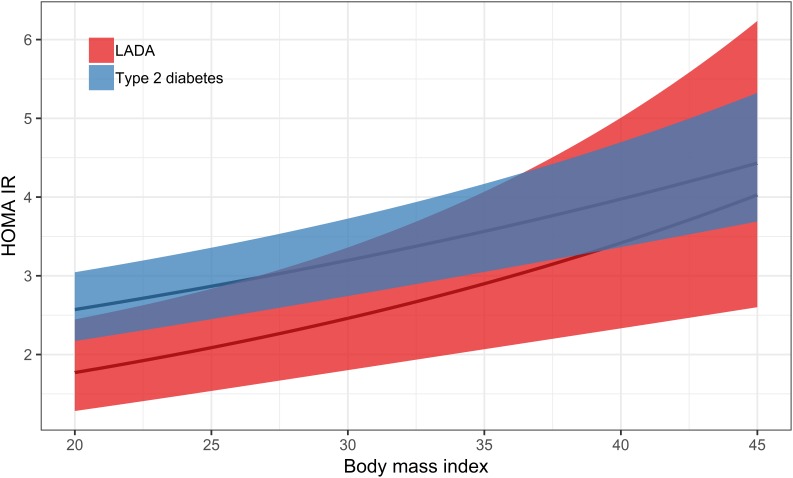
FIGURE 3.
Association between BMI and HOMA-IR in LADA and type 2 diabetes. The curved line represents results of a regression and the shaded surface represents 95% confidence intervals. Data from the ESTRID-study (data set described in Hjort et al., 2018b).

