
Fig. 3.
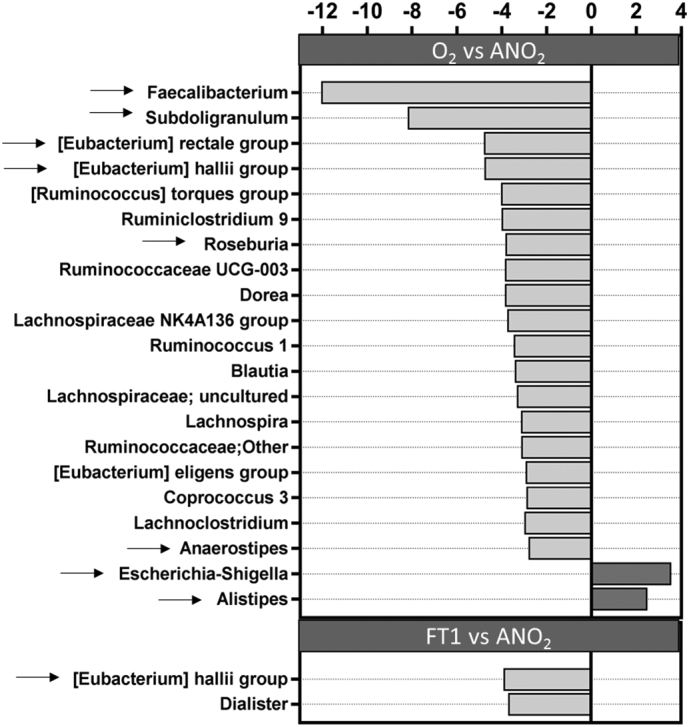
Change in the relative abundance of viable taxa after processing in ambient air (O2 vs ANO2) or after freeze-thawing (FT1 vs ANO2). Light grey bars represent decreased relative abundance and dark grey bars represent increased relative abundance. Selected bacterial taxa were further assessed by qPCR (arrows). Only taxa with at least 2·5-fold change in relative abundance are depicted.