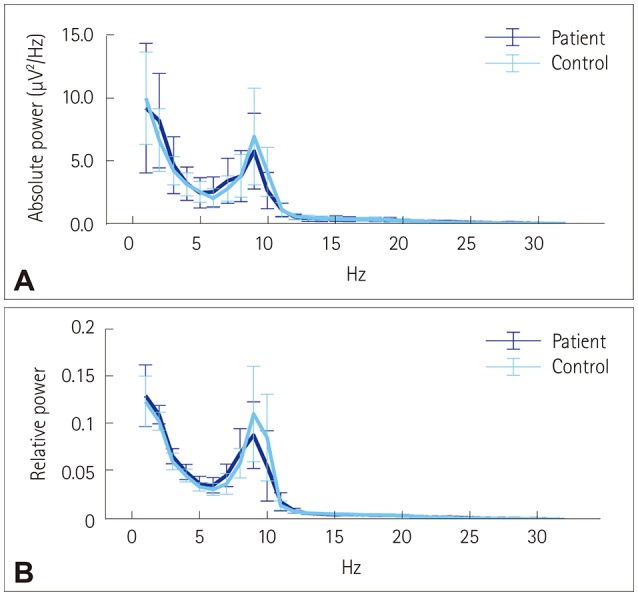
Fig. 1. Power spectral density graphs. Absolute (A) and relative (B) PSD graphs for the benign epilepsy with centrotemporal spikes and control groups, with bars showing median and median absolute deviation values. The results were similar for the PSD, and activity peaked in the lower alpha band. PSD: power spectral density.

