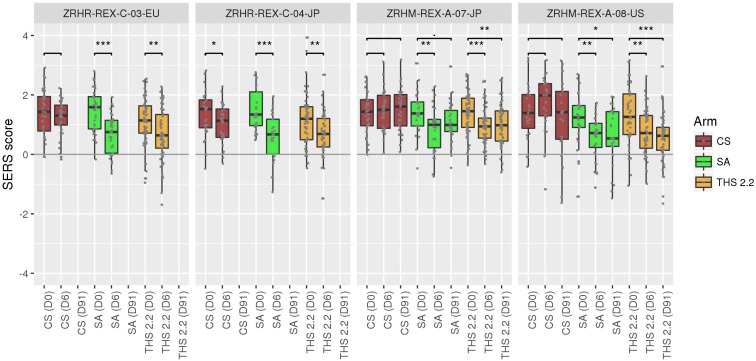
FIGURE 2.
Predictions scores for each sample in the four studies at each time point. Significant decrease (t-test p-value < 0.05) is observed between Day 6 and baseline for all the SA and THS arms, with the exception of ZRHM-REX-A-07-JP Day 91–Day 0, for which the p-value is < 0.1. Comparisons are exploratory tests and were not adjusted for multiple testing. CS: Current smokers; FS: Former smokers; NS: Never smokers [as defined in Martin et al. (2015)]; SA: Smoking abstinence; THS: Tobacco Heating System 2.2 use. D0: Day 0 (baseline); D6: Day 6; D91: Day 91. “.” indicate a t-test p-value below 0.1, ∗: below 0.05, ∗∗: below 0.01, ∗∗∗: below 0.001. T-test are two-sample unpaired, unequal variance t-tests (Welch’s t-test).

