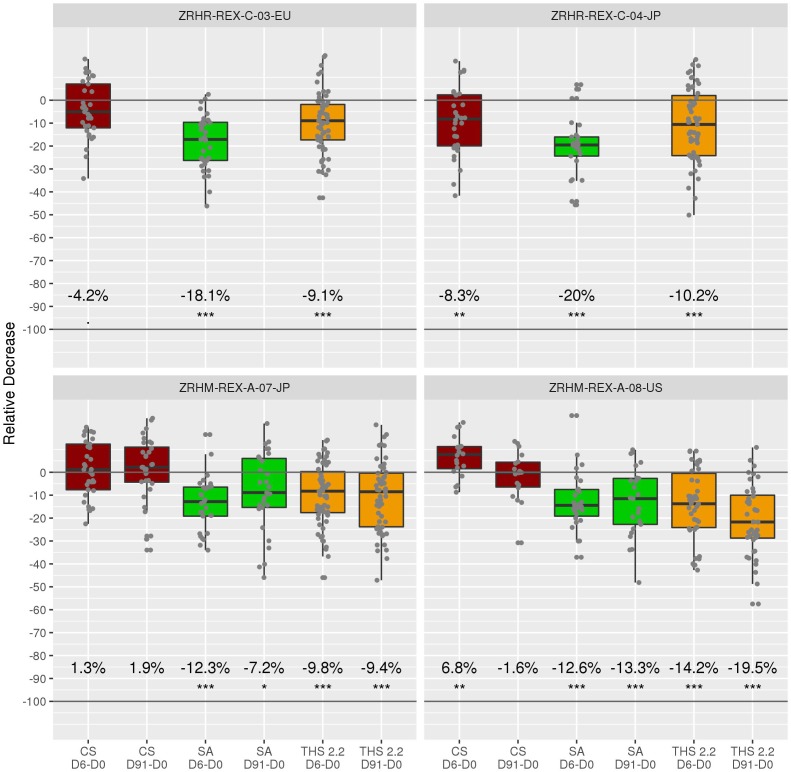
FIGURE 3.
Relative reduction for each subject across arms and studies. The primary comparisons of interest are the relative decreases in the SA and THS arms and are all expected to show a decrease. In this context, following the intersection-union test method, an overall type I error rate of 0.05 is guaranteed without the need for a multiplicity adjustment. The average decrease is indicated under the boxes. “.” indicate a t-test p-value below 0.1, ∗: below 0.05, ∗∗: below 0.01, ∗∗∗: below 0.001. D0: Day 0 (baseline); D6: Day 6; D91: Day 91. T-test refers to a one sample t-test on the baseline adjusted values (per subject).

