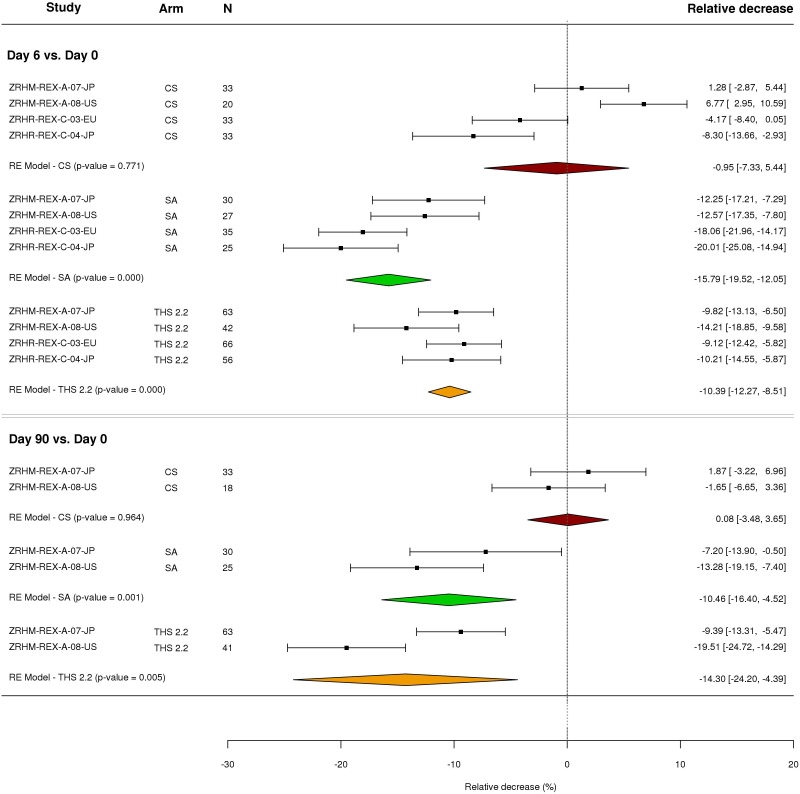
FIGURE 4.
Forest plot of the relative decreases in signature scores for the three arms and two time points across the four studies. Meta-analysis of the relative decrease of the signature score in the three arms (paired by subject) and two periods were performed with a random effect (RE) model (see Materials and Methods). The number (N) of paired differences in each arm and period are shown in the third column. For each study, arm and period, relative decreases and their confidence intervals (normal approximation) are shown on the right-hand side of the plot.

