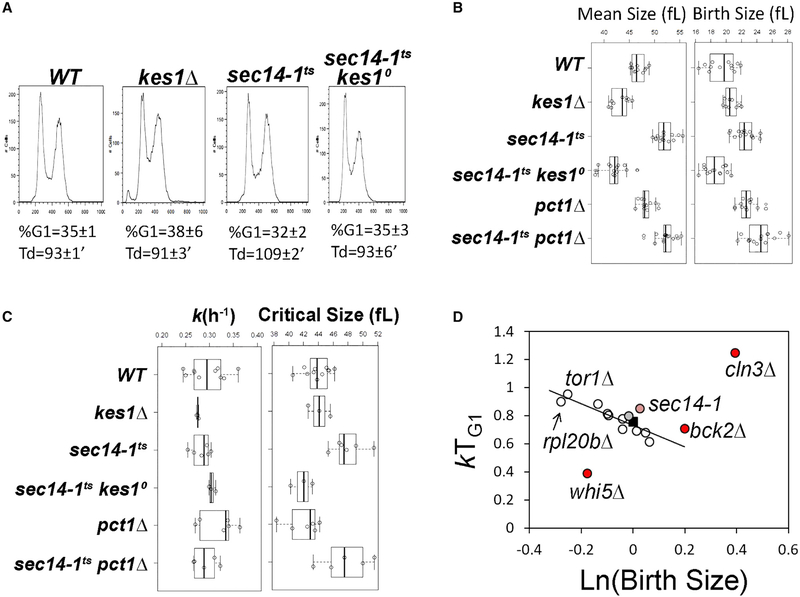
Figure 4. Mutual Antagonism of Kes1 and Sec14 in Cell-Cycle Control.
(A) DNA content histograms were determined by flow cytometry. Fluorescence per cell (FL2-A) is plotted on the x axis, while the number of cells analyzed for each condition is plotted on the y axis. The average of the fractional representation of cells with G1 content in the population (% G1), and standard deviations (n = 6), are shown, along with the corresponding generation times (Td) in each case. Genotypes are identified at top.
(B) Boxplots reporting the mean and birth cell size (y axis, in fL) of asynchronously proliferating populations of yeast with the indicated genotypes. Each symbol (open circle) corresponds to an independent biological replicate where 30,000–150,000 individual cells were measured for each replicate.
(C) Boxplots depicting the specific rate of cell size increase, k (in hr−1, left panel), and critical size (in fL, right panel) of synchronous cells of the indicated strains are shown.
(D) The relative growth in size during the G1 phase (kTG1, y axis) for the indicated mutants are plotted as a function of the natural logarithm of normalized birth size values (WT = 1). The line depicts the linear fit (obtained with the regression function of Microsoft Excel) of data from all mutants. Established cell-cycle regulator mutants are shown as controls (in red; whi5, defective in the repressor of passage through G1; cln3, defective in a G1 cyclin; bck2, a transcriptional activator of G1 cyclins; previously reported in Soma et al., 2014). Values for WT (black square), the sec14–1ts mutant (light red), and sec14–1ts kes1Δ cells (gray) are highlighted.

