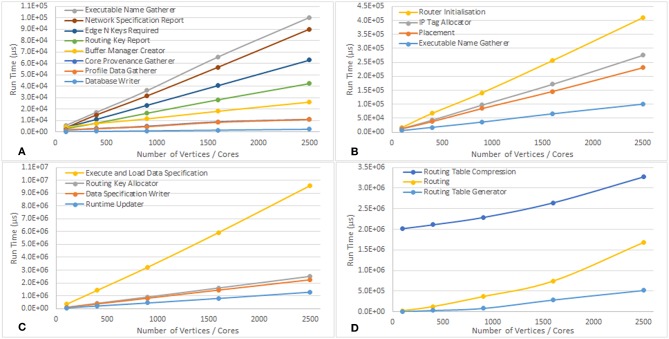
Figure 12.
Graphs showing how the run time of the various parts of the tool chain scale with the number of vertices in the Conway's Game of Life simulation. (A–C) Show the algorithms which scale linearly, and have been separated to account for the different scales of the run times. (D) Shows how some of the algorithms scale non-linearly.

