Figure 1.
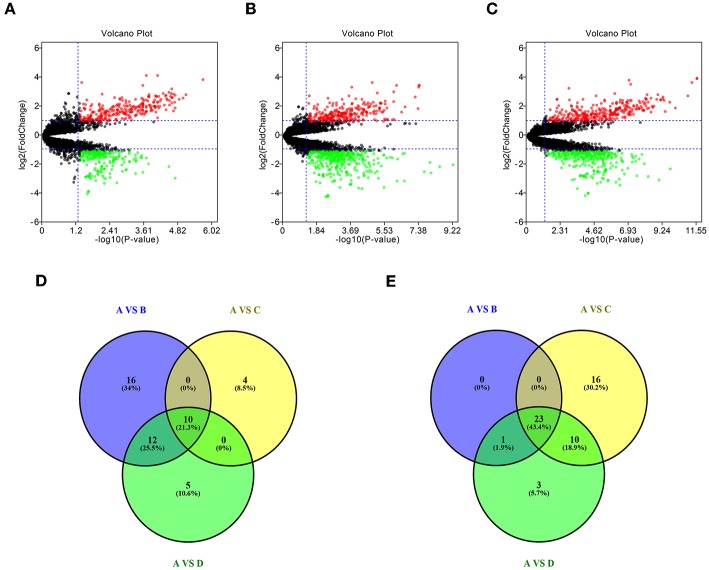
Identification of differentially expressed miRNAs (DE-miRNAs). (A) DE-miRNAs between group A and group B; (B) DE-miRNAs between group A and group C; (C) DE-miRNAs between group A and group D; (D) intersection of upregulated DE-miRNAs in three compared sets; (E) intersection of downregulated DE-miRNAs in three compared sets. Group A contained GBM tumor tissue samples (n = 16); group B contained adjacent normal brain tissue samples from GBM patients (n = 4); group C contained normal brain tissue samples from healthy volunteer (n = 3); group D contained normal samples from group B and C (n = 7). |log2FC| > 2 and adj P < 0.05 were set as the thresholds for identifying DE-miRNAs. Red dots and green dots represent the upregulated and downregulated miRNAs in GBM tumor samples, respectively; black dots represent miRNAs that are not differentially expressed between tumor samples and normal samples.

