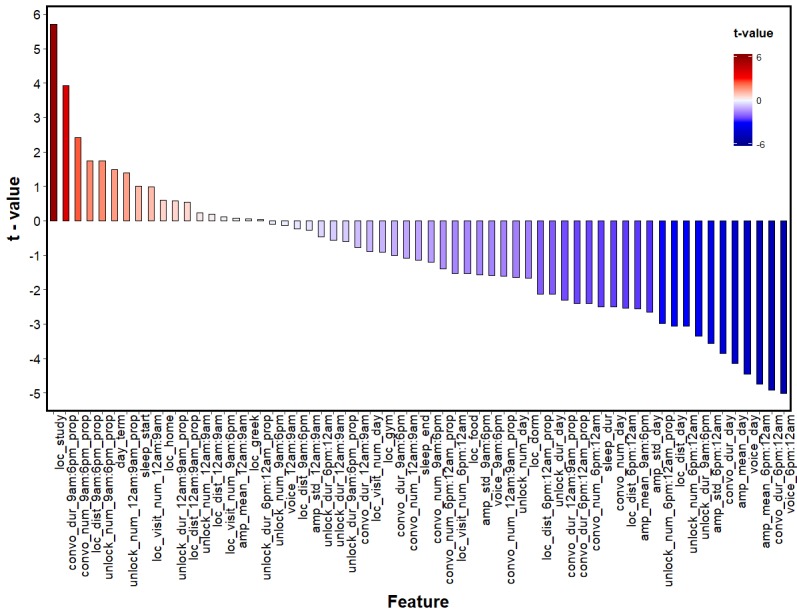
Figure 3.

Relationship between stress and sensing features using t values to depict the relationship in a pairwise fashion. Amp: amplitude; convo: conversation; day: sensing data across an entire day; dist: distance; dur: duration; loc: location; num: number; prop: proportion of sensing data occurring within a time period; std: standard deviation.
