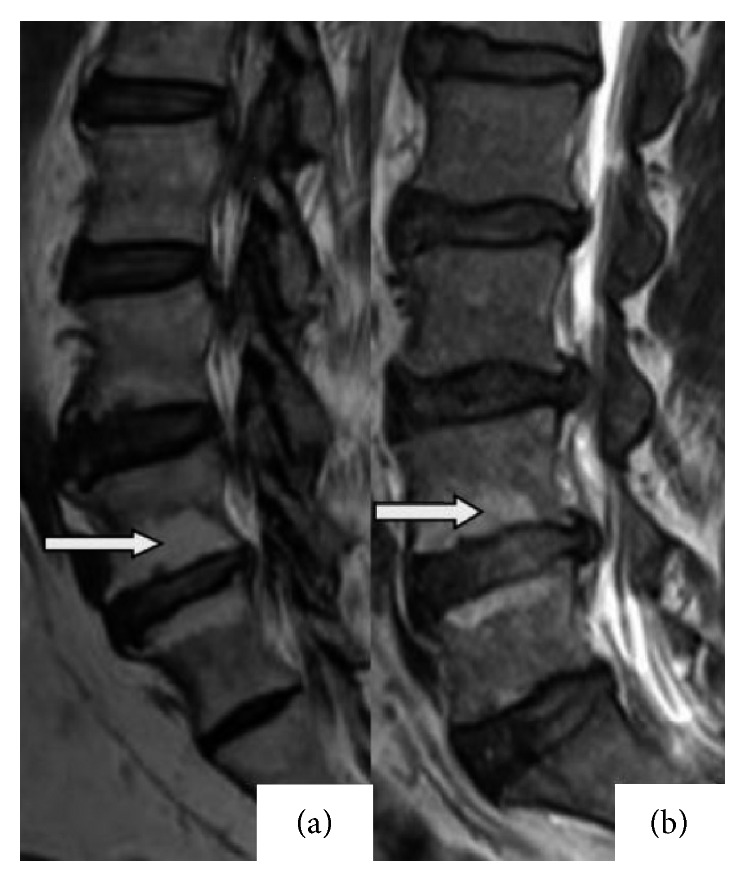
Figure 2.

Illustration of Modic type II changes. (a) Hyperintense changes on T1-weighted images at the L4 vertebral lower endplate and L5 vertebral body upper endplate. (b) Hyperintense changes on T2-weighted images at the L4 vertebral lower endplate and L5 vertebral upper endplate.
