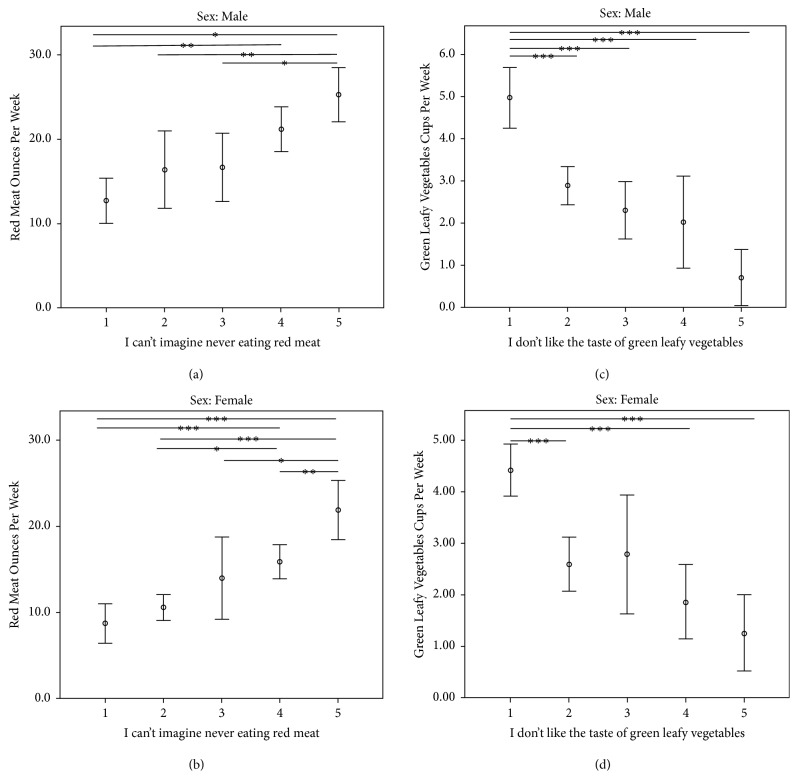
Figure 1.
Subjective measures of red meat and green leafy vegetable intake of United States men and women relative to survey question responses regarding diet preferences. On the X-axis, the numbers 1-5 correspond to Likert scale ratings: 1 = strongly disagree; 2 = disagree; 3 = neither agree nor disagree; 4 = agree; 5 = strongly agree. Intake of food groups is reported as means with 95% confidence interval error bars. Differences in intake between response groups were assessed via ANOVA with Bonferroni correction for multiple comparisons. (a) Red meat consumption (ounces per week) of men by response categories of DHCCBS Q8: I can't imagine never eating red meat. 55.3% of men agreed or strongly agreed with Q8. (b) Red meat consumption (ounces per week) of women by response categories of DHCCBS Q8. 50.7% of women agreed or strongly agreed with Q8. (c) Green leafy vegetable consumption (cups per week) of men by response categories of DHCCBS Q7: I don't like the taste of green leafy vegetables. 14.5% of men agreed or strongly agreed with Q7. (d) Green leafy vegetable consumption (cups per week) of women by response categories of Q7. 14.9% of women agreed or strongly agreed with Q7. (∗ = p < 0.05; ∗∗ = p < 0.01; and ∗∗∗ = p < 0.005).

