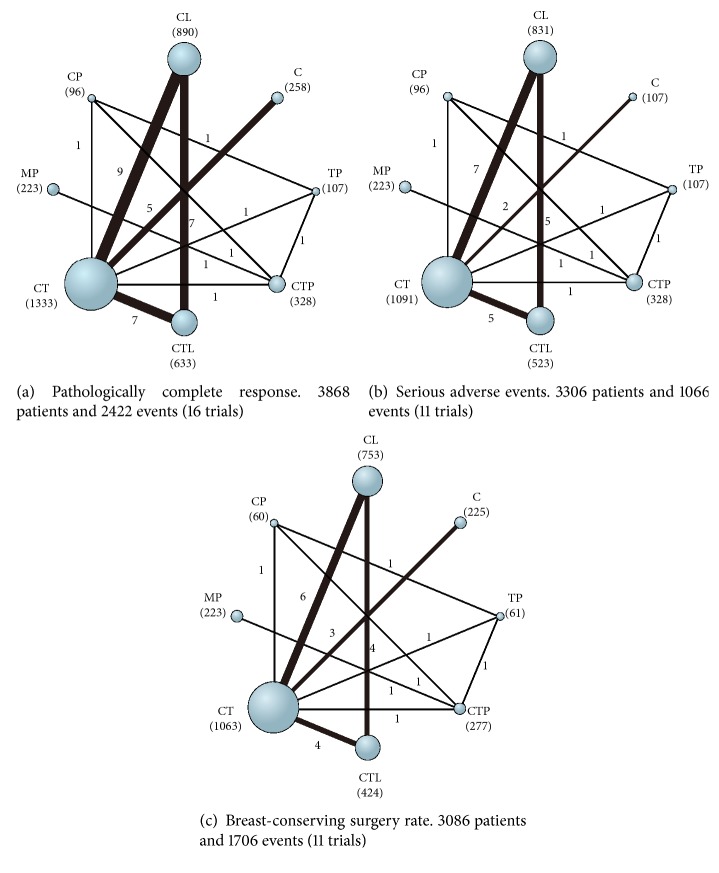
Figure 2.
Network diagrams of available treatment comparisons for each outcome. The size of the nodes is proportional to the number of patients (in parentheses) randomized to each treatment, and the width of the lines is proportional to the number of trials (beside the line) comparing the connected treatments. C indicates chemotherapy; CL, chemotherapy plus lapatinib; CP, chemotherapy plus pertuzumab; CT, chemotherapy plus trastuzumab; CTL, chemotherapy plus trastuzumab plus lapatinib; CTP, chemotherapy plus trastuzumab plus pertuzumab; MP, trastuzumab emtansine plus pertuzumab; TP, trastuzumab plus pertuzumab.

