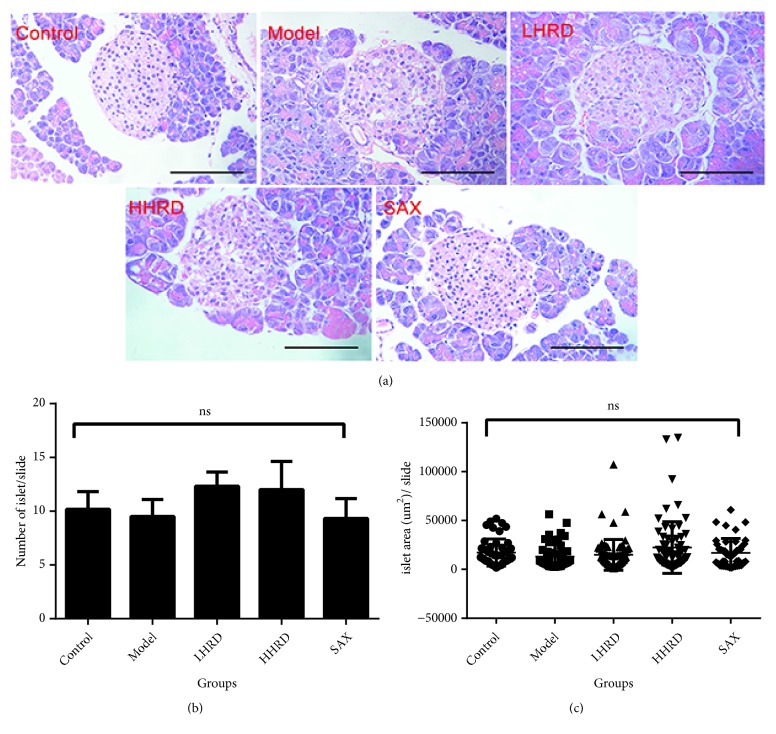
Figure 3.
Islet histology based on H&E staining. The islet quantity and area were analysed by one-way ANOVA. (a) Pictures of H&E-stained sections showing the islet histology. (b) The scatter diagram presents the islet area in a slide as the mean ± SD. (c) The column shows the islet number in a slide as the mean ± SEM. No difference was found between groups. n=6-10 mice in each group. ns, not significant. All images were taken with electronic microscope (×400).

