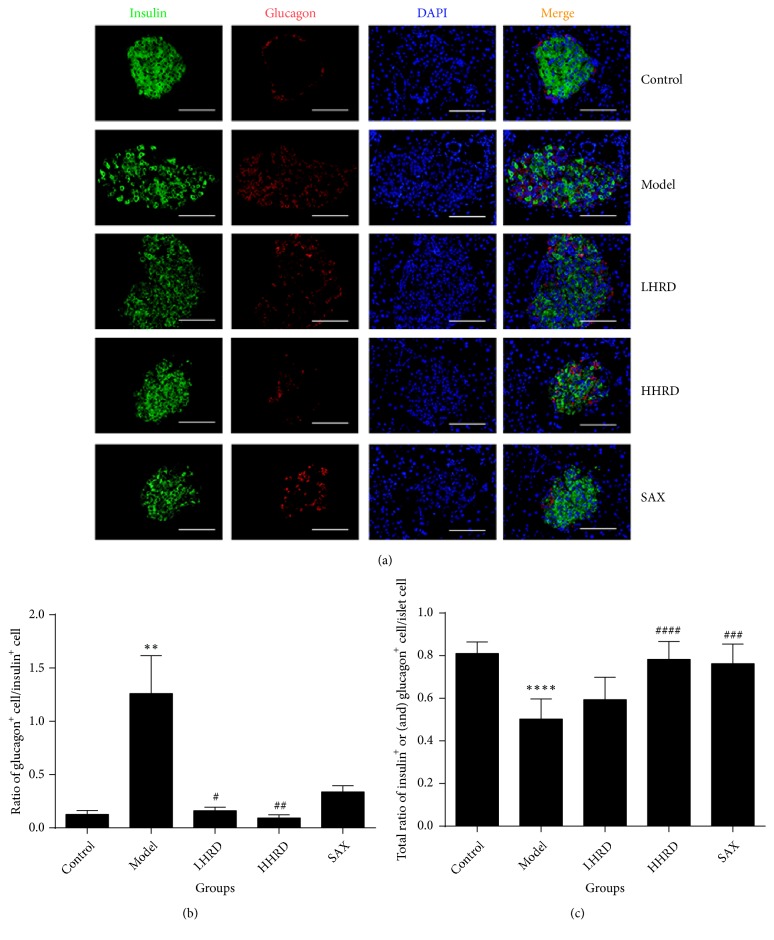
Figure 4.
Immunofluorescence images of insulin and glucagon in the pancreas. (a) Immunofluorescence images showing the glucagon (red) and insulin (green) expression. DAPI staining indicates the nuclei (blue). (b) The data show the ratio of glucagon+ cells to insulin+ cells as the mean± SEM. (c) The data show the total ratio of glucagon+ and/or insulin+ cell to islet cells as the mean± SD. ∗∗ represented p < 0.01 model versus control group, ∗∗∗∗ represented p < 0.0001 model versus control group, # represented p < 0.05 intervention versus model group, ## represented p < 0.01 intervention versus model group, ### represented p < 0.001 intervention versus model group. All immunofluorescence images were taken with a fluorescence microscope (×400).

