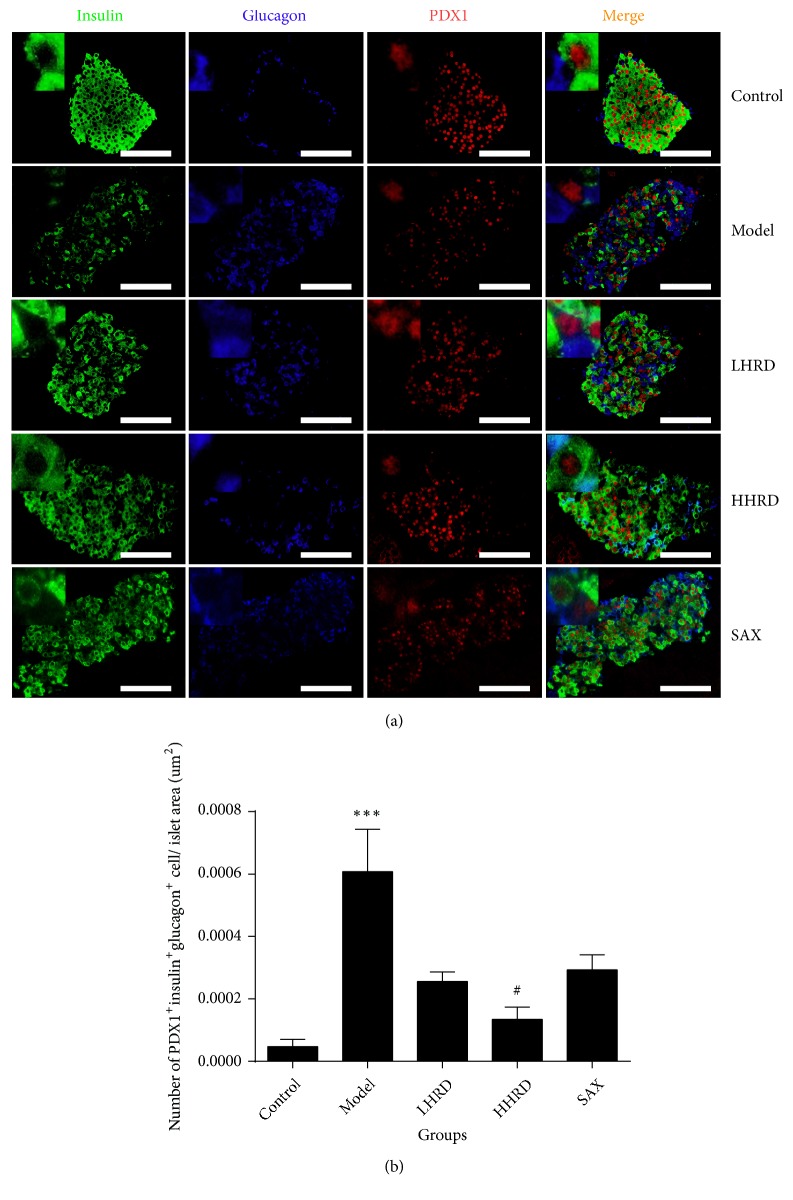
Figure 6.
Immunofluorescence images of PDX1/insulin/glucagon coexpression in pancreas. (a) The immunofluorescence images show glucagon (blue), insulin (green), and PDX1 (red) coexpression in the islets. (b) The data showed the ratio of PDX1+ insulin+ glucagon+ cells to the islets area (um2) as the mean ± SEM. n= 6-8 mice in each group. ∗∗∗ represented p < 0.001 versus control group, # represented p < 0.05 versus model group. All immunofluorescence images were taken with a fluorescence microscope (×400).

