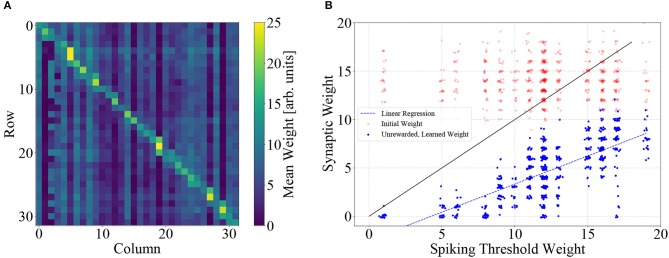
Figure 6.
(A) Synaptic weight matrix after learning, averaged over the 10 trials depicted in Figure 5. Weights on and near the diagonal dominate, corresponding to the goal of the learning task. The noticeable vertical stripes are a direct consequence of learning, which implicitly compensates neuronal variability (each column represents all input synapses of an action neuron). (B) Learning compensates circuit variability. Weights corresponding to unrewarded actions (R = 0) are systematically pushed below the threshold weight of the respective neuron, i.e., below the main diagonal. This leads to a correlation of learned weight and threshold (Pearson's r = 0.76). Weights are plotted with slight jitter along both axes for better visibility.

