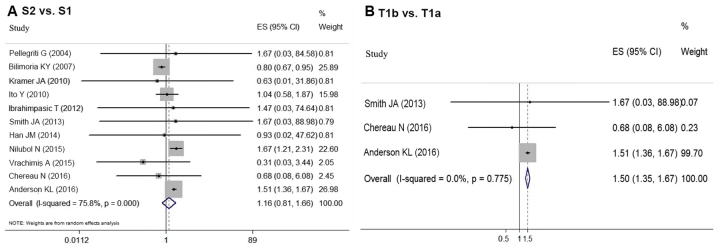
Figure 3.
The OR for the association between tumor size and survival in sDTC is shown with 95% CIs. (A) Comparison between group S2 vs. S1 using the random effects model, and (B) T1b and T1a using the fixed effects model. CI, confidence interval; OR, odds ratio; sDTC, small-differentiated thyroid carcinoma.

